
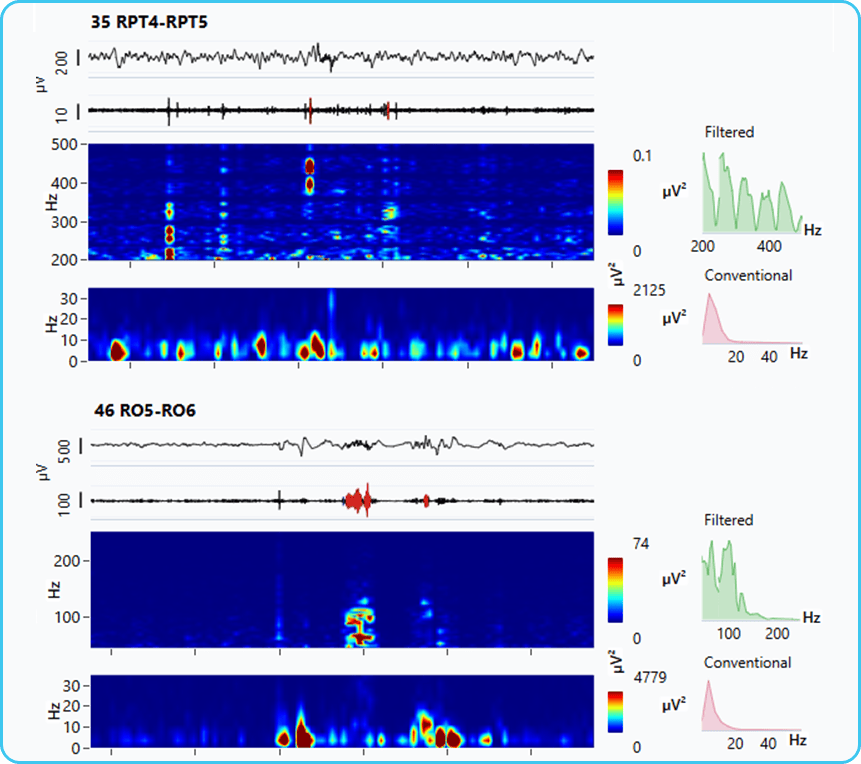
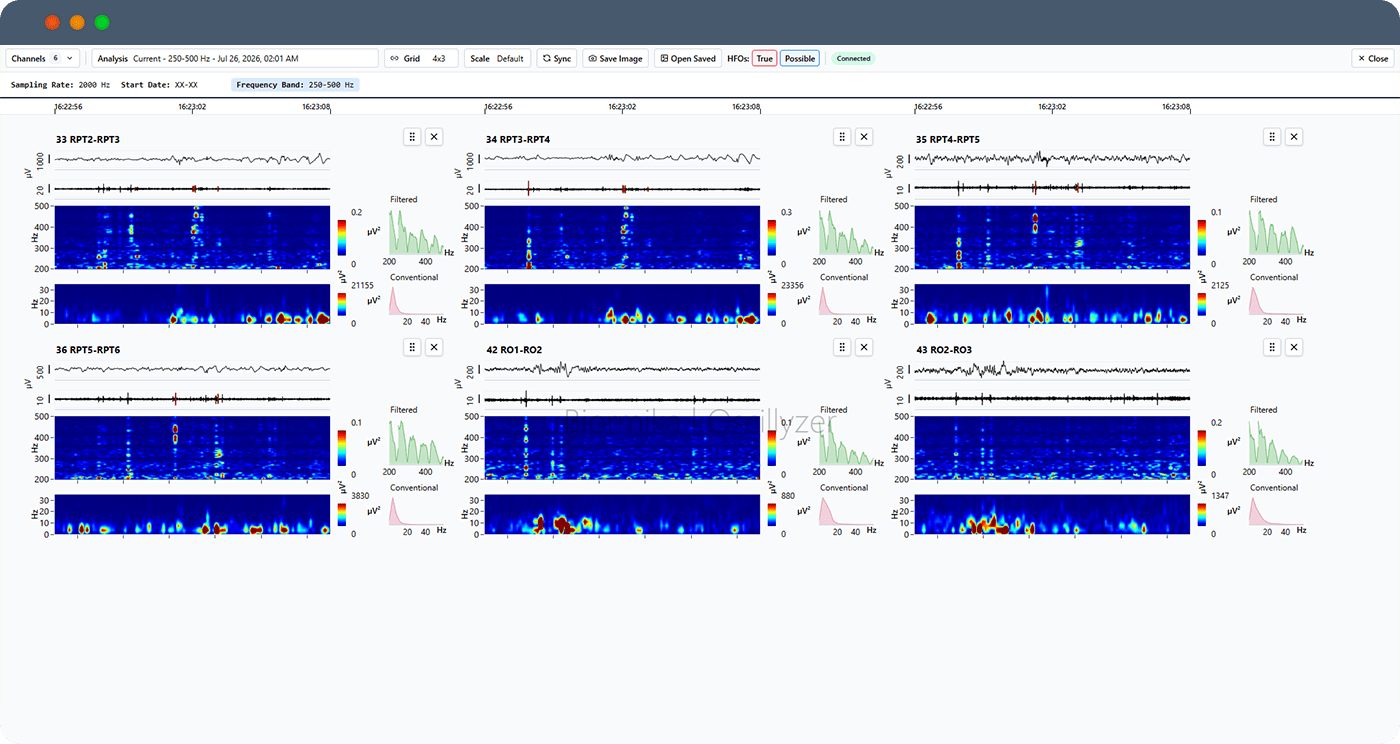
Snapshot of HFOs in the frequency domain
Oscillyzer™ – TFP feature works in conjunction with Oscillyzer™ to display the HFOs in the frequency domain using time-frequency plots (TFP) and power spectral density (PSD) plots.
TFP plots make it easier to see the different types of HFOs such as ripples and fast ripples. PSD plots show the distribution of the various frequenices in the EEG signal over time.
See the HFOs in different frequency bands. Get a better appreciation of ictal HFOs at seizure onset and follow their evolution.
Workflow
Intuitive and informative
Login
Access the platform on your browser
View
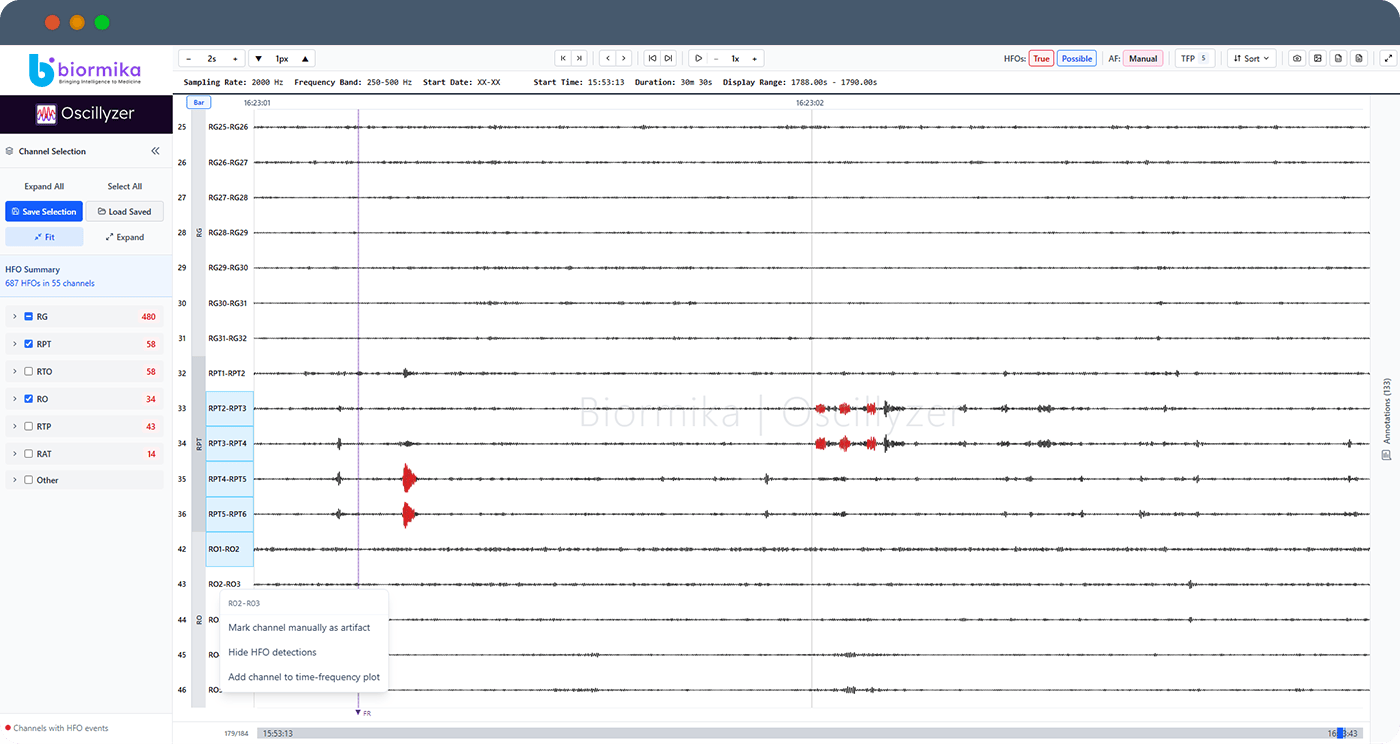
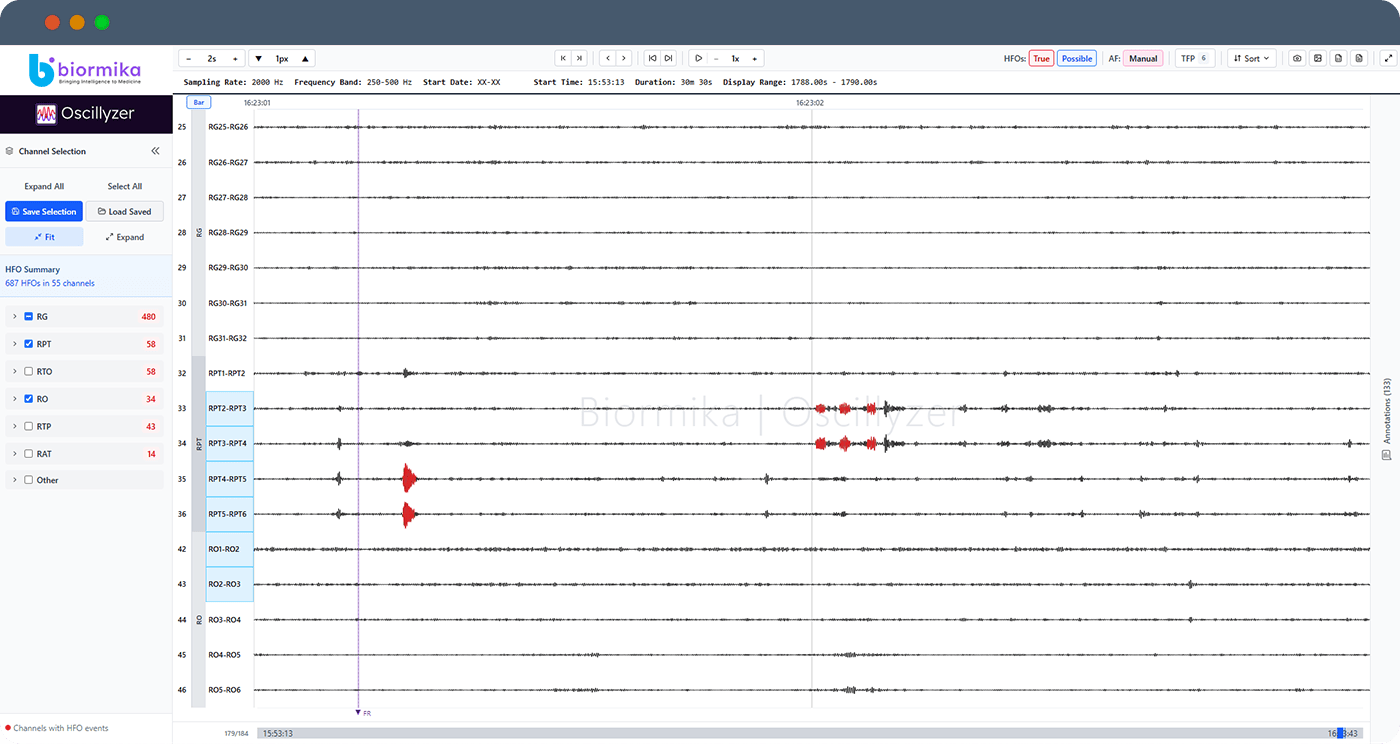
Launch Oscillyzer™ to view the waveforms
Add
Select the channels to add for TFP analysis
Sync
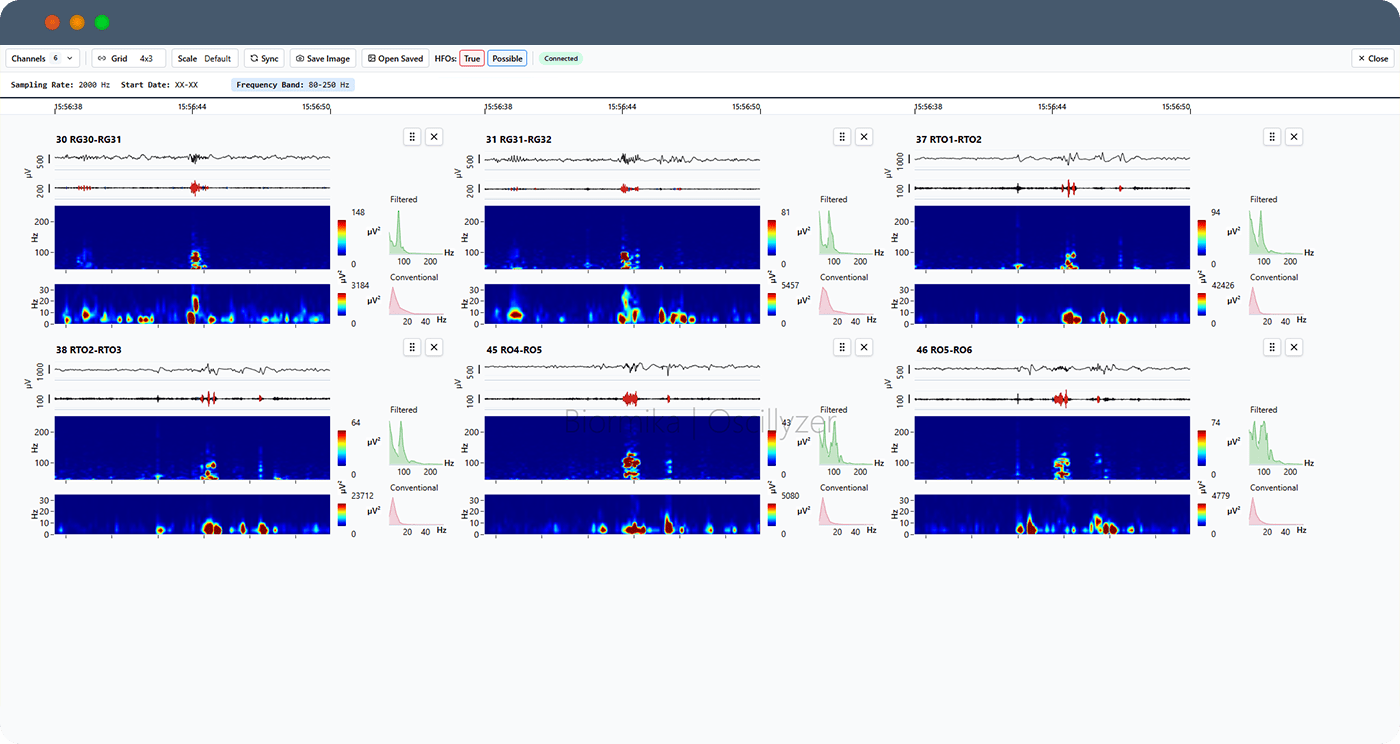
Generate the plots and sync to the window
Slide
Slide
Slide
Slide

Warning: Biormika products are currently available for research use only. They are not approved for clinical use by the FDA or any other regulatory agency. Click here for details.
Oscillyzer™ - TFP: Intuitive graphics. Better insight.
Frequency bands
Easily recognize ripples, fast ripples, gamma, and conventional activity
Temporal distribution
Distinguish nonevolving interictal HFOs from evolving ictal HFOs
Spatial synchrony
Assess synchrony between channels implanted in different brain regions